Energy Systems and Infrastructure Analysis
Electric Vehicle Charging Equity Considerations
Ensuring investments in electric vehicle charging benefit disadvantaged communities
Electric Vehicle Charging and the Justice40 Initiative
Many of the burdens from the transportation and energy systems have been historically and disproportionately borne by disadvantaged communities. Unequal distribution of benefits from the transportation and energy systems has prevented disadvantaged communities and minority-owned and women-owned businesses from realizing equitable benefits from these systems, while other historic barriers to transportation have made facilities inaccessible to individuals with disabilities. For these reasons, it is important to emphasize equity considerations when planning investments in electric vehicle charging stations and avoid exacerbating existing disparities in the transportation system.
The Justice40 Initiative, established in January 2021 by Presidential Executive Order 14008 on Tackling the Climate Crisis at Home and Abroad, states a goal that at least 40 percent of the overall benefits of certain Federal investments flow to disadvantaged communities (DACs). The Interim Implementation Guidance for the Justice40 Initiative, released in July 2021, identifies clean transportation as a Justice40 covered program and identifies access to electric vehicle charging stations as an example benefit of a covered program.
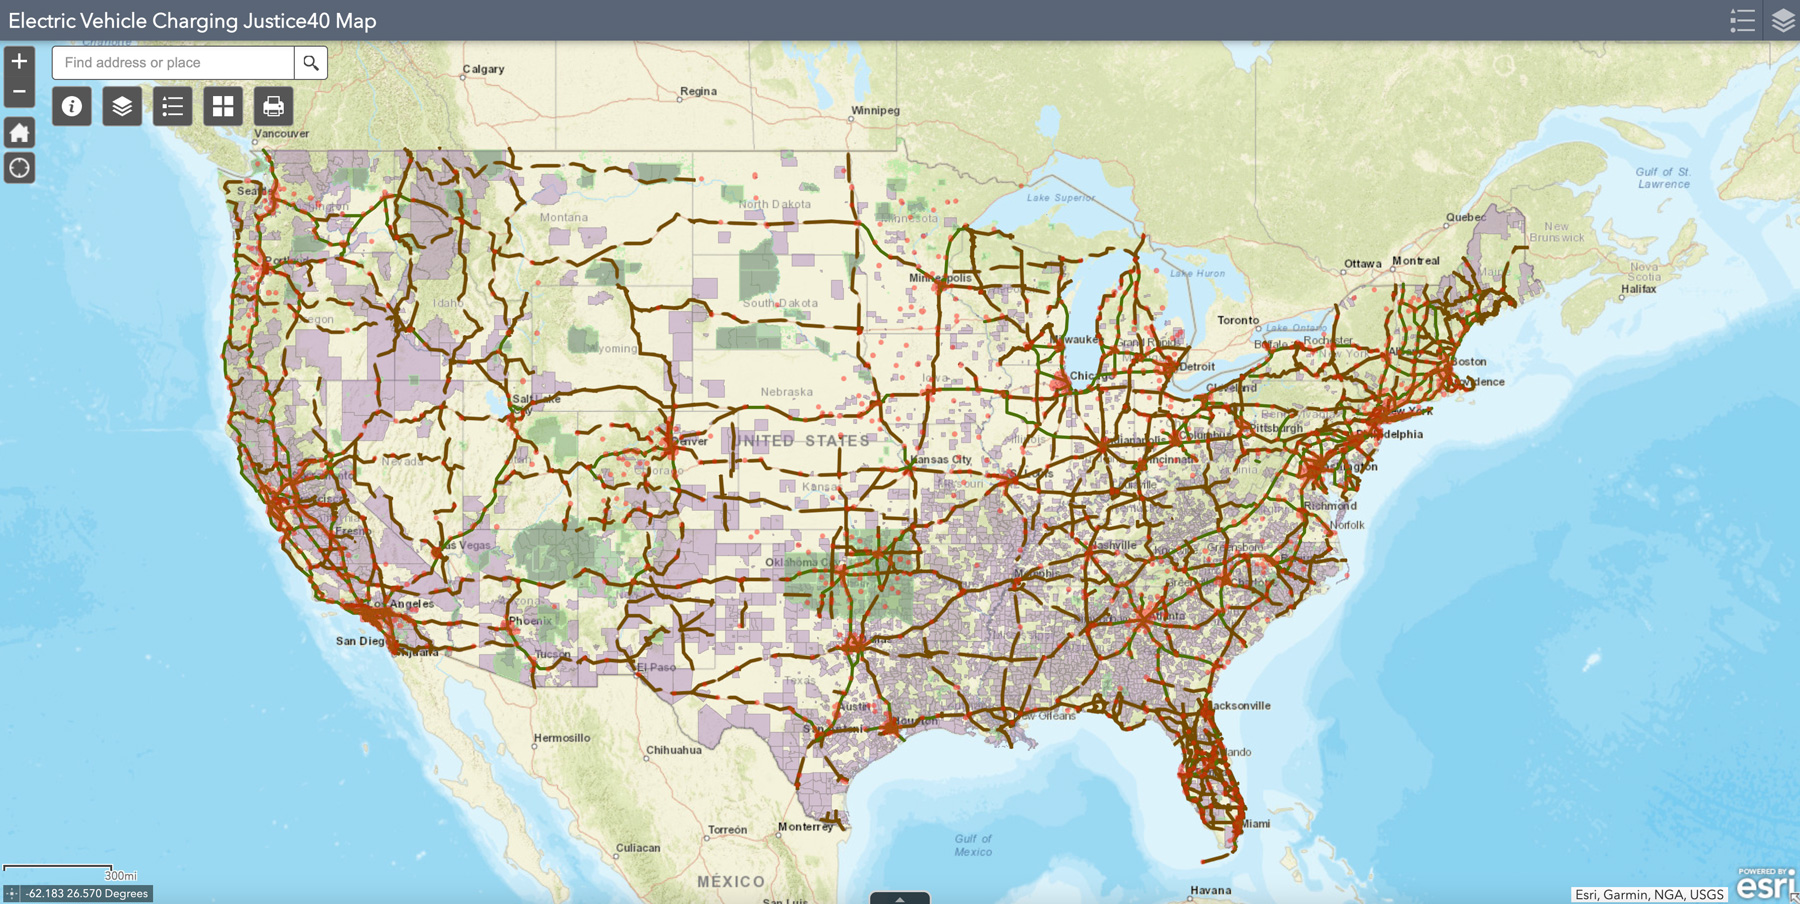
Electric Vehicle (EV) Charging Justice40 Map Tool
As part of DOT’s work in implementing the Justice40 Initiative, the Department developed an interim definition for disadvantaged communities (“DACs”) that may be used under Justice40-covered grant programs. In order to help grant applicants determine whether the locations of their proposed projects were in a DAC, the Department created a mapping tool, which went live on Jan. 28, 2022. The Department subsequently conducted a data review and found that the mapping tool had data errors affecting approximately 11% of U.S. Census tracts. The NEVI Mapping tool was updated on May 17, 2022 to reflect the correct data.
Additional background information is available at Justice40 Initiative | US Department of Transportation.
Consistent with the Justice40 Interim Guidance, U.S. Department of Transportation (DOT) and U.S. Department of Energy (DOE) developed a joint interim definition of disadvantaged communities (DACs) for the National Electric Vehicle Infrastructure (NEVI) Formula Program. The joint interim definition uses publicly available data sets that capture vulnerable populations, health, transportation access and burden, energy burden, fossil dependence, resilience, and environmental and climate hazards. The joint interim definition for the NEVI program includes three components:
- Combined census tracts from DOT’s working DAC definition and DOE’s working DAC definition (see methodology section below for more information);
- Tribal Lands; and
- U.S. Territories.
The geographic area associated with these three DAC components can be viewed on the Electric Vehicle (EV) Charging Justice40 Map tool.
Methods to Define “Disadvantaged” Census Tracts for the NEVI Formula Program Guidance
Justice40 is a whole of government initiative, and it is expected that the Council on Environmental Quality (CEQ), the National Climate Advisor, and the Office of Management and Budget (OMB) will release a BETA geospatial Climate and Economic Justice Screening Tool in 2022 to assist Federal agencies with targeting investments to disadvantaged communities. In the interim, federal agencies, as per Justice40 Interim Guidance, have developed interim definitions of disadvantaged communities. The Justice40 Interim Guidance suggests agencies consider using existing data sources and indicators, e.g., poverty, high energy/housing/transportation burden and others to define disadvantaged communities in the context of their programs
The Justice40 Interim Guidance defines a community as either:
- a group of individuals living in geographic proximity (such as census tract),
- or a geographically dispersed set of individuals (such as migrant workers or Native Americans), where either type of group experiences common conditions.
For the NEVI guidance, DOT and DOE combine their two distinct interim definitions of disadvantaged communities, which highlight energy and transportation-burdened communities, communities facing high rates of environmental pollution, those whose economies are highly dependent on fossil energy sources, and those with high rates of social vulnerability. Recognizing historical injustices perpetrated on indigenous communities, regardless of the current indicators in the underlying data, federally-recognized Tribal Nations and the U.S. Territories are also included as disadvantaged communities for the purposes of the NEVI program.
DOE Methodology
The DOE working definition for DACs was developed by an internal and external collaborative research process and includes data for 36 indicators collected at the census tract level representing the following categories. The numbers in parenthesis show how many indicators fall in that category:
- Fossil Dependence (2)
- Energy Burden (5)
- Environmental and Climate Hazards (10)
- Vulnerability (socioeconomic, housing burden, transportation burdens, etc.) (19)
To identify the census tracts that could be considered energy disadvantaged, the DOE Justice40 team took four steps:
- For each census tract, the percentile value is calculated for each of the 36 indicators, where the 99th percentile represents the most disadvantaged.
- The 36 percentiles are then summed to create a score for each tract. The final scores for each tract could range from 0 to 36, where 36 would represent the largest disadvantage. Each indicator is given equal weight.
- Based on this score, the top 20 percent of census tracts in each state are selected to ensure that relative disadvantage is captured and that every state is represented.
- To ensure wealthier locations are not inadvertently included, DAC eligibility is further restricted based on income. A census tract selected in step 3 is identified as a DAC if at least 30% of households:
- are at or below 200% of Federal Poverty Level and/or
- are considered low-income households by the Department of Housing and Urban Development (HUD), defined as making 80% of area median income.
DOT Methodology
The DOT working definition for DACs was developed by an internal and external collaborative research process and includes data for 22 indicators collected at the census tract level and grouped into six (6) categories of transportation disadvantage. The numbers in parenthesis show how many indicators fall in that category:
- Transportation access disadvantage identifies communities and places that spend more, and take longer, to get where they need to go. (4)
- Health disadvantage identifies communities based on variables associated with adverse health outcomes, disability, as well as environmental exposures. (3)
- Environmental disadvantage identifies communities with disproportionately high levels of certain air pollutants and high potential presence of lead-based paint in housing units. (6)
- Economic disadvantage identifies areas and populations with high poverty, low wealth, lack of local jobs, low homeownership, low educational attainment, and high inequality. (7)
- Resilience disadvantage identifies communities vulnerable to hazards caused by climate change. (1)
- Social disadvantage identifies communities with a shared history of discrimination, racism, or other forms of disadvantage that warrant consideration along with each/any of the above measures. (1)
To identify the census tracts that could be considered transportation disadvantaged, the DOT Justice40 team took four steps:
- For each census tract, the percentile value is calculated for each of the 22 indicators, where the 99th percentile represents the most disadvantaged.
- Within each category, the average percentile for each tract is calculated.
- For each category, a tract is assigned a value of one (1) if it is in the 50th percentile of disadvantage (percentile ranking average = .5 or higher) and zero (0) otherwise. For the resilience category only, a tract is assigned a value of one (1) is it is in the top 75th percentile of disadvantage (.75 or higher).
- The scores for each category are summed for each census tract, resulting in a score ranging from zero (0), not in the 50th percentile of disadvantage in any category, to six (6), ranking in the 50th percentile of disadvantage in each of the six categories.
- A census tract is considered transportation disadvantaged if it has a score of four (4) or higher, interpreted as ranking in the top 50% of the average scores in each category, where higher scores represent more disadvantage.
Underlying Indicators and Sources in Both the DOE and DOT Definitions of Disadvantaged Communities
|
|
|
Data Source |
|
|
Variable |
Description |
DOT |
DOE |
|
>30 min commute |
Percent of total population with a drive time to employment greater than or equal to 30 minutes |
(1) |
(1) |
|
No Vehicle |
Percent of total population with no vehicle(s) available |
(2) |
(1) |
|
Walkability |
A composite index of economic and built environment characteristics representing the extent to which the location is not supportive to walking |
(3) |
n/a |
|
Transportation Burden |
Transportation Costs % Income for the Regional Typical Household |
(1)+ (14) |
(4) |
|
Population 65 and older |
Percent of total population over age 64 |
(2) |
(5) |
|
Uninsured |
Percent of population without health insurance |
(2) |
(1) |
|
Disability |
Percent of the non-institutionalized population with any disability |
(2) |
(1) |
|
Homes Built Before 1960 |
Percent of housing units built before 1960 (lead paint indicator) |
(5) |
(5) |
|
Diesel |
EJ Index for Diesel particulate matter level in air |
(5) |
(5) |
|
Cancer |
EJ Index for Air toxics cancer risk |
(5) |
(5) |
|
Traffic Proximity |
EJ Index for Traffic proximity and volume |
(5) |
(5) |
|
Water Discharge |
EJ Index for Indicator for major direct dischargers to water |
n/a |
(5) |
|
NPL Proximity |
EJ Index for Proximity to National Priorities List (NPL) sites |
n/a |
(5) |
|
RMP Proximity |
EJ Index for Proximity to Risk Management Plan (RMP) facilities |
n/a |
(5) |
|
TSDF Proximity |
EJ Index for Proximity to Treatment Storage and Disposal (TSDF) facilities |
n/a |
(5) |
|
PM25 |
EJ Index for PM2.5 level in air |
(5) |
(5) |
|
Ozone |
Ozone level in air |
(5) |
n/a |
|
Parks |
Negative count of parks per census tract |
n/a |
(6) |
|
Less HS Education |
Percent of total population, age 25 and older, whose reported education is short of a high school diploma |
(2) |
(5) |
|
Renters |
Proportion of occupied housing units not occupied by property owners |
(1) |
(4) |
|
Unemployment |
Percent of civilian labor force reported as unemployed |
(2) |
(1) |
|
GINI Index |
Endemic inequality |
15 |
n/a |
|
Low Income |
Percent of total population reported at or below area median income |
(2) |
(1) |
|
Poverty |
Percent of population below Federal Poverty Level |
(2) |
n/a |
|
Housing Costs |
Housing Costs % Income for the Regional Typical Household |
(1) |
(4) |
|
Fossil energy employment |
Percent of total civilian jobs in the fossil energy sector |
n/a |
(7) |
|
Coal employment |
Percent of total civilian jobs in the coal sector |
n/a |
(7) |
|
Job Access |
Job Access Score (0-10) |
n/a |
(4) |
|
Incomplete Plumbing |
Percent of occupied housing units without complete plumbing |
n/a |
(1) |
|
Single Parent |
Proportion of family households with children under age 18 with only one parent |
n/a |
(1) |
|
Mobile Home |
Percent of total population in mobile homes |
n/a |
(1) |
|
Non-grid-connected heating fuel |
Percent of households that use a fuel other than grid-connected gas or electricity or solar energy as their main heat source |
n/a |
(1) |
|
Food Desert |
Share of neighborhood without access to affordable or good-quality fresh food (Percentage who live within 1/2 mile (urban) or 10 miles (rural) of supermarket |
n/a |
(8) |
|
Linguistic Isolation |
Percent of households (interpreted as individuals) in linguistic isolation |
(2) |
(5) |
|
Internet Access |
Percent of Households with No Internet Access |
n/a |
(9) |
|
Homelessness |
Representative of homeless population; calculated using total number of Sheltered and Unsheltered Population per sq. km |
n/a |
(10) |
|
Energy Burden |
Annual average energy burden based on average annual housing energy costs divided by the average annual household income |
n/a |
(11) |
|
Outage Events |
Number of power outage events that occurred for all census tracts in each county from 2017-2020 |
n/a |
(12) |
|
Outage Duration |
Average duration of power outage events (in minutes) that occurred for all census tracts in each county from 2017-2020 |
n/a |
(12) |
|
Climate Hazards |
Expected annual loss from 18 climate hazards |
n/a |
(13) |
|
Climate Hazards |
Expected annual loss of life, building value, and agricultural value from 18 climate hazards |
(13) |
n/a |
Data Sources
- U.S. Census Bureau. American Community Survey (ACS) 5 Year Estimates 2015-2019. 2019.
- Center for Disease Control. Social Vulnerability Index (SVI) [Internet]. 2018 [cited 2021 Oct 20]. Available from: https://www.atsdr.cdc.gov/placeandhealth/svi/index.html
- Ramsey K, Bell A. Smart Location Database: Version 2.0. Environ Prot Agency EPA. 2014;1–52.
- Center for Neighborhood Technology. H + T Index Methods. 2017.
- U.S. Environmental Protection Agency. EJSCREEN: Environmental Justice Screening and Mapping Tool [Internet]. 2021 [cited 2021 May 5]. Available from: https://www.epa.gov/ejscreen
- Esri. USA Parks [Internet]. 2019. Available from: https://www.arcgis.com/home/item.html?id=578968f975774d3fab79fe56c8c909…
- Interagency Working Group on Coal and Power Plant Communities and Economic Revitalization. Initial Report to the President on Empowering Workers Through Revitalizing Energy Communities. 2021; (April).
- USDA ERS - Food Access Research Atlas [Internet]. [cited 2022 Jan 6]. Available from: https://www.ers.usda.gov/data-products/food-access-research-atlas/
- U.S. Department of Commerce National Telecommunications and Information Administration. Indicators of Broadband Need. 2021; Available from: https://broadbandusa.ntia.doc.gov/resources/data-and-mapping
- U.S. Department of Housing and Urban Development. Continuum of Care GIS Tools [Internet]. [cited 2022 Jan 6]. Available from: https://www.hudexchange.info/programs/coc/gis-tools/
- U.S. Department of Energy. Low-Income Energy Affordability Data (LEAD) Tool [Internet]. [cited 2022 Jan 6]. Available from: https://www.energy.gov/eere/slsc/low-income-energy-affordability-data-l…
- U.S. Department of Energy Office of Cybersecurity, Energy Security and ER. Electric Disturbance Events (OE-417) Annual Summaries.
- U.S. Department of Homeland Security Federal Emergency Management Agency. National Risk Index [Internet]. 2021 [cited 2022 Jan 6]. Available from: https://hazards.fema.gov/nri/
- HUD Exchange Location Affordability Index - HUD Exchange
- FEMA Resilience Analysis and Planning Tool (GINI Index) – FEMA.gov/RAPT